Narragansett Bay Mapping Project Details Big Picture of Region’s Health and Equity
September 20, 2021
Share
For Julia Twichell, the Narragansett Bay is more than just a waterbody.
She is used to thinking about the big picture, used to conceptualizing bay health as something that extends beyond its shores and into the surrounding watershed. As something that weaves inland along the Blackstone, the Taunton and the Pawtuxet rivers upstream to Worcester and Brockton, Mass., and the Connecticut border.
And as a geographic information system (GIS) and watershed specialist with the Providence-based Narragansett Bay Estuary Program (NBEP), she is used to using data analysis to dig below the surface of the 1.3-million-acre watershed to uncover trends in environmental health.
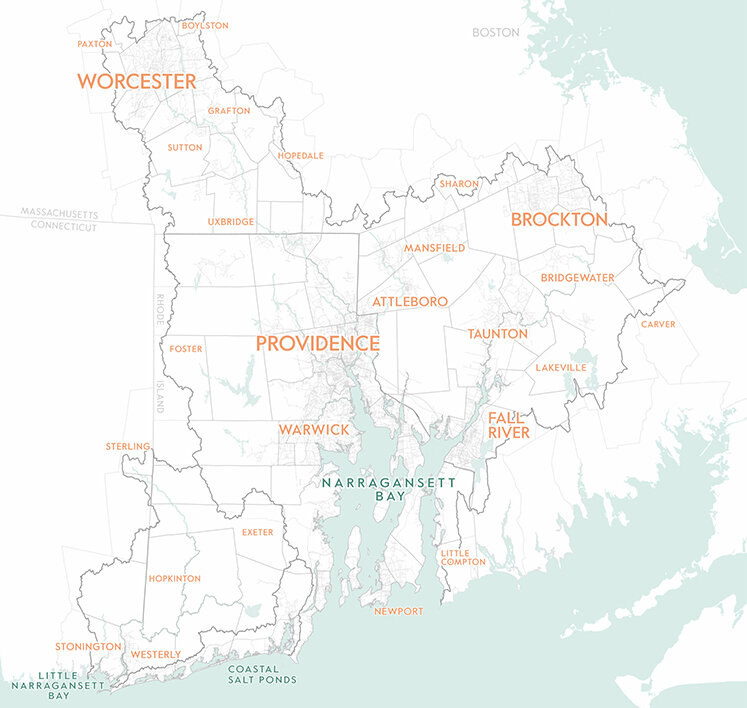
Last year, Twichell brought this familiar approach to a new set of data, looking further into how the lives of 2 million people are interwoven with the landscape and water of the Narragansett Bay region.
The result is a collection of 12 interactive, zoomable “storymaps” on all aspects of Environmental Justice in the Narragansett Bay Region. Map after map shows clear disparities in public access, open space and public transportation for many bay watershed communities.
According to the data compiled, 78 percent of priority communities lie within a half-mile of a stressed waterbody. Nutrient-loaded wastewater discharge is concentrated near priority areas. And priority communities are more likely to be located in flood zones compared to the rest of the region.
On average, under-resourced communities are home to about half the tree cover and half the green space as other communities in the watershed. With fewer trees and green infrastructure, these communities are more vulnerable to the heat-island effect, flooding and stormwater runoff.
Additionally, traffic congestion, industry and toxic air pollutants are concentrated in under-resourced areas.
“It’s a lot to take in,” Twichell said. “It’s definitely … uncomfortable, but I think what it actually shows is there’s this very clear opportunity to really focus our efforts.”
There is no simple way to quantify environmental justice, but for the project, Twichell looked to the Census data used by the Environmental Protection Agency’s EJSCREEN tool to define environmental justice “priority areas.” She used four of the six factors: percentage of people who are non-white and/or Latino; low-income; have limited English language ability; and less than a high-school education.
She collected and analyzed data on these four factors for the whole of the Narragansett Bay region, from Westerly to Worcester. Then, with the help of intern Katherine Altamirano, she mapped the data and began overlaying other environmental indicators.
It was like “putting the puzzle together,” she said. Playing around with the data, which was nothing new in itself, revealed new angles of environmental problems and “striking” correlations between the social and environmental sides of the bay and it watershed.
“I don’t think I expected everything to all line up the way it did,” Twichell said. “It’s like any way you look at it, the whole landscape has really shaped itself around where people have ended up.”
It is the result of inclusive and exclusive practices throughout history, she said. Settlement and colonization, industrialization and suburbanization, redlining and White flight — they have all left “deep and persistent inequities that will endure without thoughtful and intentional change,” according to the NBEP project.
A data-first approach has been fundamental to the NBEP since its founding as a federally funded estuarine pilot study in 1985. Over the years, as one of the EPA’s 28 National Estuary Programs, NBEP has funded more than 150 science and policy studies into all aspects of estuarine resources, use and management.
But environmental justice “wasn’t historically a focus for the program,” Twichell said. Little attention was paid to the social indicators of the environment. But last year — in part because of the pandemic and social-justice movements — she said it seemed time to reconsider this, to start looking at where they do work and understand who was benefitting most.
“I think it was just like a really powerful project for us to work on,” she said. It was known that these issues existed, but the data-driven strategy could “really put it out in black and white.”
On a personal level and as a woman of color, Twichell said, “I think it’s important for me to do sort of my part to spread the word and to use whatever my little niche of expertise is to get what’s going on.”
The online resource was built as a tool for policymakers and those “who have the power to make change,” Twichell said. But in creating the maps, she prioritized accessibility and design for a broader public audience.
“A lot of teachers are excited about this resource, too,” she said, “because their students are really clamoring for this kind of information.”
The maps are also helping NBEP to take a deeper look at what projects should take priority in the coming decade. The organization’s next 10-year plan, Vision 2032, which is still in the works, promises to “elevate justice, equity, humanity, and heritage.”
“This needs to be central in everything that we think about as we’re planning for the next 10 years,” Twichell said.
Residents of any of the 113 cities and towns in the Narragansett Bay region can help shape the next decade of watershed work and funding by attending public meetings and getting in touch with NBEP. Through an online survey, the NBEP is also hoping to gain better insight into residents’ perspectives on green space access, water quality and environmental issues.
“Our watershed just covers a huge spread of different experiences,” Twichell said, “and we’re all tied together through water.”